

Context
In CNC machining and industrial manufacturing, shop floor performance goes beyond simply measuring machine output. To effectively manage production, shop floor managers and industrial leaders rely on OEE (Overall Equipment Effectiveness), a key performance indicator based on three fundamental pillars:
- Availability (Did the machine run without breakdowns or unplanned downtime?)
- Performance (Did the machine run at the expected theoretical rate?)
- Quality (Are the parts produced conforming and usable?)
Thanks to automatic machine data collection, JITbase already enables manufacturers to measure Availability and Performance in real time with unparalleled accuracy. However, the OEE equation cannot be complete without taking Quality losses into account: defective parts, parts machined outside of tolerance, or parts that must be scrapped.
Why This New Feature?
Until now, reporting defective or rejected parts was often handled in a fragmented way: on handwritten shift sheets, directly in the ERP after the fact, or in separate Excel spreadsheets.
These manual methods create two major challenges:
- Incomplete or inaccurate OEE: Without a seamless way to record defective parts, the OEE displayed on dashboards can overstate the shop floor's actual productivity.
- A disconnect from the shop floor: Operators and team leaders did not have a direct, quick interface for recording scrap while reviewing completed jobs.
To address this key shop floor need, we introduced the Quality tab in JITbase. The goal is simple: provide you with a centralized interface to record the number of non-conforming parts, instantly calculate your Quality rate, and obtain a 100% automated, reliable, and standardized OEE.
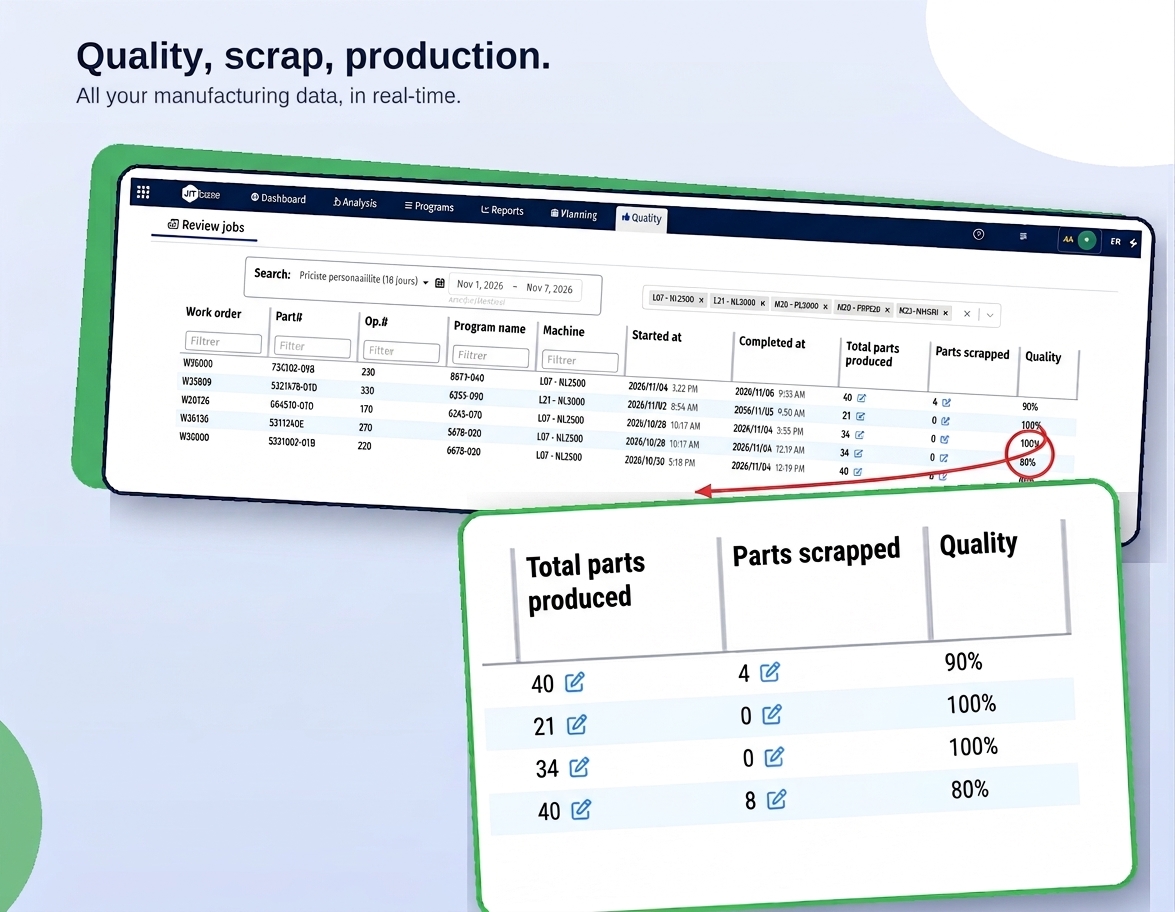
Quality Tab
Your Operational Gains
Activating the new Quality tab brings tangible benefits at every level of the organization:
- Complete OEE accuracy: Automatically integrate the Quality component (Quality Rate = Good Parts / Total Parts Produced) to obtain an unbiased view of your shop floor efficiency.
- Simplified Job Review: Team leaders and supervisors can review completed batches, validate the final number of conforming parts, and adjust scrap quantities in just a few clicks.
- Immediate visibility into financial losses: Every machined part that is subsequently scrapped represents a loss of machine time, energy, and material. Tracking this data helps you directly target continuous improvement initiatives.
- Greater team accountability: Providing operators with an intuitive tool to record quality issues improves transparency and facilitates daily communication routines (e.g., shift handover meetings / daily stand-ups).
A Real-World Example
Let's take a concrete example from a CNC machining workstation:
Example: Machining "Aero-Part-402"
- Job Execution: The machine produces 100 parts during a shift. JITbase sensors record the production rate and machining time (Performance and Availability data).
- Quality Inspection & Scrap Entry: During an in-process or final dimensional inspection, the operator or quality inspector identifies 4 parts with a critical burr caused by a worn tool. These parts must be scrapped.
- Recording the Scrap in JITbase:
- The user clicks on the new Quality tab.
- They enter the number of non-conforming parts for the relevant job: 4 scrap parts.
- Automatic KPI Calculation and Update:
- JITbase immediately deducts the 4 defective parts from the 100 parts produced, resulting in 96 good parts.
- The Quality rate is automatically calculated at 96%.
- OEE is recalculated using the updated Quality rate.
New Quality Reports
Recording non-conforming parts does more than dynamically update your overall OEE in your existing reports. It also powers two new dedicated reports in JITbase, helping you manage quality with greater precision:
- Quality Over Time: Track how your Quality rate evolves over the period of your choice (day, week, month, or year). This report helps you quickly detect trends, identify periods with high scrap rates, and measure the impact of your corrective actions.
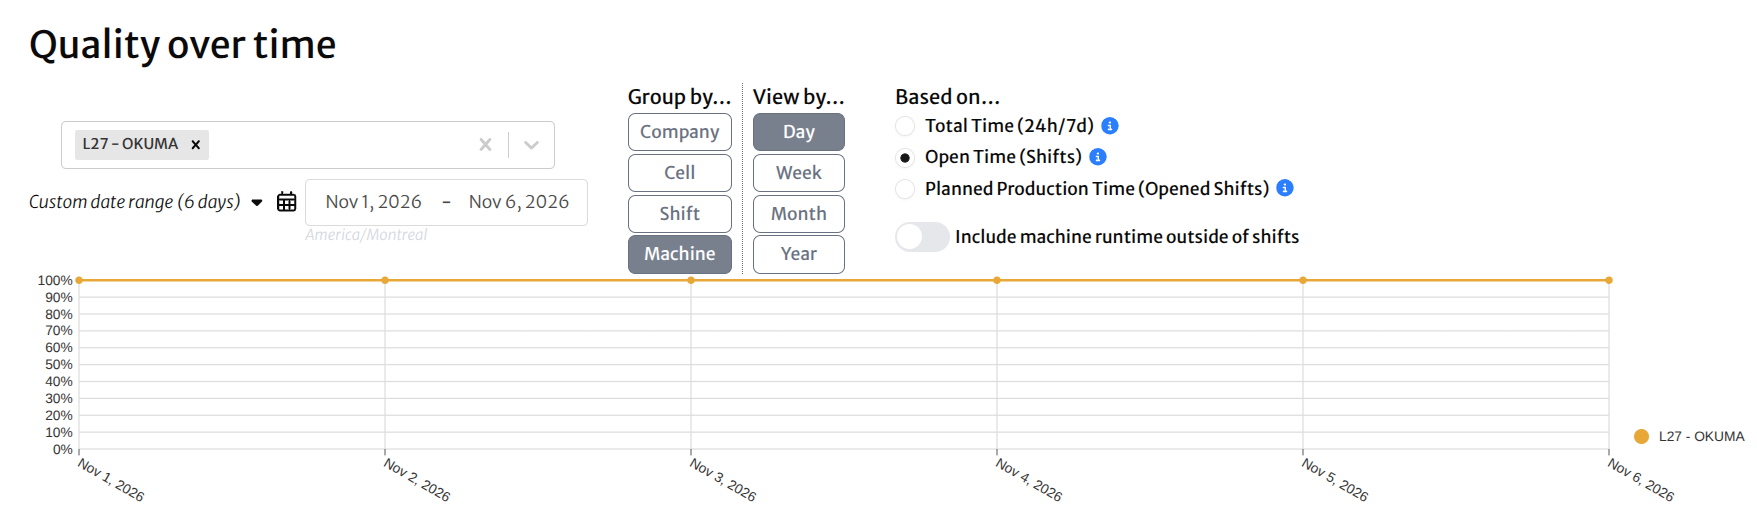
Quality over time
- Quality by Machine: Compare the performance of your different machines or equipment by shift (Morning, Afternoon, Night). This report is ideal for identifying whether a quality issue is isolated to a specific machine (e.g., mechanical wear, repeatability issues) or to a particular shift.
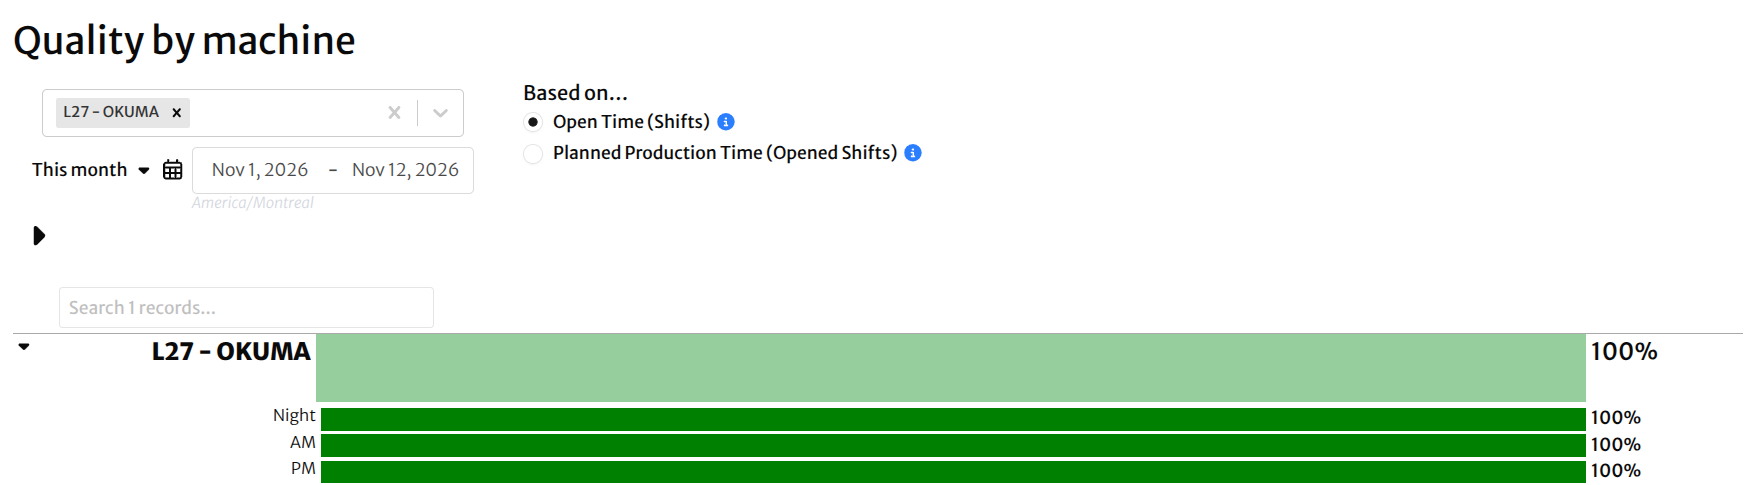
Quality by machine
Please note: By default, if no defective parts are reported for a given job or period, the displayed Quality rate automatically remains at 100%. Only scrap entries (manual or automated through an ERP) impact the trend and adjust your actual OEE.
Video Preview
Coming soon in english.