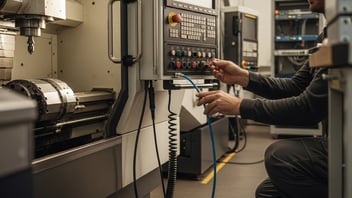

Integrating shop-floor telemetry into planning systems is often treated as a high-risk project that requires downtime and extra headcount. This guide shows how to connect machine, cycle and labor data to your ERP/MES safely and in small increments, without stopping production. Read on for a seven-step plan, pilot metrics, non-intrusive data capture techniques, and concrete validation checks you can run in the first two weeks.
TL;DR:
- Start small: inventory your machines and target three high-value fields for the pilot (work-order status, cycle time, availability). Expect 90 to 95% of events to be timestamped in week one.
- Use an edge-first gateway with read-only access, MTConnect/OPC UA or spindle-power sensors to capture cycle time without changing NC code. Run 1 to 2 week iterations and roll back if the integration causes more than one unplanned stop.
- Automate normalization and reconciliation (map machine_id to the ERP asset, calculate discrete cycles), use webhook APIs for near-real-time updates, and keep the reconciliation backlog under 1% of daily events.
Step 1: Map all shop-floor data sources and define the integration scope
A complete inventory prevents scope creep and unpleasant surprises during deployment. Create a spreadsheet with one row per data source and at least these columns: machine_id, control type (Fanuc, Siemens, Haas), PLC tags or channel IDs, NC program identifiers, operator tablet IDs, expected cadence (events per minute), and the business use case (for example work-order status, cycle time, downtime code). Include data points such as timestamps, tool-change events, cycle start and stop, spindle hours, operator IDs, and work order numbers.
Standards and protocols to note: OPC UA, MTConnect, and plain G-code metadata are common on modern cells. For older equipment, add external sensors (spindle power, current clamps) and PLC readouts. If your shop tracks WIP or takt time in an ERP, link these mappings to your WIP fields. The WIP tracking guide explains which fields matter most.
Two scope strategies:
- Broad scope: ingest many signals (temperature, coolant flow, CMM results). Advantage: more analytics later. Risk: longer rollout and more integration points.
- Narrow scope (recommended start): focus on high-value, low-risk fields such as work-order status, discrete cycle time, and availability or downtime codes. You can expand later.
Step 2: Choose a non-disruptive integration architecture (edge, cloud or hybrid)
Decide between edge-first, cloud-first, or hybrid based on latency, security, and analytics needs. Edge-first keeps data near the machine, reduces latency and risk to the plant network, and provides local buffering if the WAN drops. Cloud-first centralizes analytics but increases bandwidth needs and requires hardened network segmentation. A hybrid model streams critical events (work-order updates, cycle completions) to the cloud while keeping raw telemetry local.
Middleware options:
- Message broker (MQTT) for high-throughput, small-payload events.
- Lightweight gateway or ETL for protocol translation (OPC UA → JSON).
- Scheduled batch ETL for low-frequency reconciliations.
Protocols and interfaces to support: MQTT, REST APIs, SOAP (legacy ERP), OPC UA, MTConnect. Estimate throughput early. A single CNC producing a cycle event every 2 minutes generates about 30 events per hour, and a 20-machine shop at that cadence generates 600 events per hour, so plan for peak bursts during changeovers.
Security prerequisites include network segmentation (a separate VLAN for monitoring), TLS for transport, credential management, and read-only access to controllers. For industrial control system security, NIST publishes a detailed reference in NIST SP 800-82 Rev. 3, Guide to Operational Technology Security, and the ISA/IEC 62443 series covers security for industrial automation and control systems.
Step 3: Prepare a pilot plan and test on one cell without changing production flow
Run the pilot on one representative cell or machine. Pick it using these criteria: a typical part mix, common NC program types, and stable operators. Lock a test work order in your ERP/MES and assign a single operator as point of contact.
Define success metrics:
- Data completeness: at least 95% of cycle events timestamped.
- Latency: more than 95% of events delivered within the SLA (for example 30 seconds for near-real-time labor tracking).
- Reconciliation rate: fewer than 2% mismatched events per day.
- Safety: zero unplanned machine stops attributable to the integration.
Pilot checklist:
- Create a dedicated test account in the ERP/MES and a labeled test work order.
- Make sure backup communication (cellular or a separate LAN) is available.
- Set rollback criteria: if the integration causes any production-impacting error, disable it and revert to manual logs.
- Get stakeholder sign-off: the operations manager, IT, and the shop-floor supervisor sign a short rollout charter.
Keep iterations short, with 1 to 2 week sprints, and track the pilot metrics in dashboards or simple spreadsheets. If the pilot meets its objectives, scale by cell or part family. If not, diagnose the issues using the troubleshooting section below.
Step 4: Capture machine and cycle data non-intrusively
Start with methods that avoid editing NC code or stopping the machine. Options ranked by risk and speed:
- Read-only PLC taps: connect to PLC read registers or discrete inputs and poll for spindle on/off, axis motion, and tool-change signals. Accuracy is high for PLC-backed cells and the risk is low if access is read-only.
- Controller API or serial port reads: many modern CNCs expose telemetry through an API or an Ethernet port. Use existing vendor APIs carefully and always in read-only mode.
- Network capture for MTConnect/OPC UA: if the controller already exposes MTConnect streams or OPC UA endpoints, capture those over the shop subnet for rich telemetry.
- External sensors: spindle power clamps, accelerometers, or RTD sensors provide non-invasive signals where no network access exists.
To extract cycle and standard times without editing NC programs, parse G-code metadata and timestamps, or derive cycles from spindle-on and axis-motion sequences. The step-by-step guide to extracting cycle times from G-code details the workflow.
The same signals can also feed part counts. A cycle-complete event is usually the natural trigger for incrementing a counter, so it is worth designing the counting logic at the same time as the cycle logic. The guide to automatic part counting in CNC shops explains how to validate counts against operator declarations.
Where to place edge gateways: mount them near the machine's Ethernet port or power source, keep them off the control LAN, and ensure technicians have physical access. If hardware is constrained, consider the options described in minimal-hardware cycle-time monitoring.
Capture accurate cycle times without manual data entry. Automatically extract cycle times from machine signals and CNC programs to improve scheduling accuracy, reduce reconciliation work, and eliminate unreliable manual logs.
See how automatic cycle-time capture worksStep 5: Normalize, validate and transform data for ERP/MES ingestion
Raw events are not ready for an ERP. Build a canonical data model that maps machine signals to ERP/MES fields: machine_id → ERP asset tag, raw_event → discrete_cycle record, timestamp → operation start/finish, and tool_change → tool_id. Keep a versioned mapping table under source control.
Validation rules to automate:
- Completeness: reject events missing work_order_id or operator_id and flag them for manual reconciliation.
- Temporal sanity: drop timestamps outside shift windows or tag them with a confidence score.
- Cycle outlier detection: flag cycles longer than 3 times the median for manual review.
- Duplicate detection: deduplicate by a unique event hash (machine_id + program_line + timestamp window).
Example transformation logic:
- Raw spindle-on and axis-motion bursts create a cycle record with start = first spindle-on, finish = last spindle-off, and duration = finish minus start.
- Map the program name to an operation ID by joining to an operations master table. If nothing matches, write the event to an exception queue.
Handle time zones and shift boundaries carefully: convert all timestamps to UTC at ingestion, then apply local shift boundaries when computing shift-level metrics. This avoids misassigning cycles when shifts cross midnight.
Normalized data can feed an OEE dashboard. For guidance on building one, see the article on how to build an OEE dashboard.
Connect CMM inspection data directly to your production workflows. Integrate CMM machines with real-time shop-floor tracking to improve traceability, reduce manual reconciliation, and feed reliable inspection data into ERP and MES systems.
See how CMM integration improves workflow efficiencyStep 6: Integrate and sync with the ERP/MES while minimizing manual touchpoints
Choose push (webhook or API) or pull (scheduled polling) based on latency needs and ERP capabilities. Push suits near-real-time labor tracking and alerts. Pull works for daily reconciliations when the ERP has strict API rate limits.
Match events to ERP work orders
- Best case: events carry a work_order_id from an operator tablet or job ticket scan.
- Common fallback: match by machine_id, program name, timestamp window and operator_id. Automate confidence scoring and push low-confidence matches to an exceptions queue.
Decide how to handle mismatches:
- Exception queue in the MES: holds unmatched events for a planner to resolve (low disruption, but manual).
- Auto-created placeholders in the ERP: creates a minimal work-order record so the event attaches automatically (reduces manual work but requires cleanup later).
Implement robust error handling: retries with exponential backoff for transient API errors, idempotent writes to prevent duplicates, and dead-letter queues for persistent failures. Instrument reconciliation dashboards to surface KPIs such as API error rate, reconciliation backlog, latency percentiles, and daily unmatched count. To push labor events and attendance data, see our guide to real-time labor tracking, and for the benefits of feeding schedules with near-real-time data, read how real-time data enhances manufacturing scheduling and efficiency.
If the shop uses lightweight schedulers that take shop-floor feeds, consider low-cost scheduling tools that accept webhook inputs.
Respect ERP API rate limits and batch sizes. For example, many ERPs accept batches of 100 events every 30 seconds. Tune batching to avoid throttling while keeping latency acceptable for the use case.
Step 7: Scale the rollout, monitor integration health and optimize without stopping production
Scale in phases: by cell, by shift, or by part family. Each expansion should pass a simple gate: data completeness above 95%, reconciliation backlog under 1% of daily events, and an error rate under 0.5% over a 48-hour window.
Monitoring metrics to track:
- Data completeness percentage per machine.
- Reconciliation backlog count and age.
- API error rate and retry success percentage.
- Latency percentiles (p50, p95, p99) for event delivery.
Set up drift detection to catch mapping changes. For example, if a program name changes or an asset tag is altered, send automated alerts and place the affected events in an exception queue. For governance, use change control for updates to the canonical model and schedule quarterly mapping audits.
Feedback loops are essential. Share daily or weekly reports with planners and operators and ask for corrective actions on persistent mismatches. When you adjust operator workload or shift plans as the integration scales, review these shift planning techniques and the capacity strategies in how to increase production capacity.
When WAN or cloud connectivity drops, local buffering on the edge gateway protects data integrity. Make sure reconcilers can merge buffered events and detect duplicates, matching by timestamp and operator if IDs are missing.
Common mistakes and troubleshooting when integrating shop-floor data with ERP/MES
Mistake: assuming all machines speak the same protocol
- Root cause: heterogeneous shop floors with legacy equipment.
- Fix: adopt an abstraction layer in your gateway that normalizes protocols (MTConnect, OPC UA, serial) and use external sensors where controllers lack interfaces.
Mistake: mapping machine IDs to ERP assets incorrectly
- Root cause: inconsistent asset tags or manual transcription errors.
- Fix: run a reconciliation audit. Compare the list of reachable assets, event counts per machine, and manual logs for one day. Use a mapping table and a one-time reconciliation job to align machine_id to the ERP asset. If IDs are missing, match by program name, operator and timestamp window.
Troubleshooting network impacts and isolating integration-induced issues
- Diagnostic checks: ping devices, capture event counts by hour, and compare them to manual shift logs.
- If the plant network shows latency spikes after installation, isolate the monitoring VLAN and switch to an edge-only buffer, following the security guidance referenced in Step 2.
Quick fixes
- Data gaps: enable local buffering on the gateway and replay after restore.
- Duplicate events: implement event hashing and idempotent writes at the middleware layer.
- Misaligned timestamps: convert all timestamps to UTC on ingest, then apply shift offsets when reporting.
If events continue to mismatch, create a small daily task for an operator or planner to resolve the top 10 exceptions. This keeps the backlog small while improvements are deployed.
The bottom line
A staged, read-only approach to connecting shop-floor data to your ERP reduces risk and delivers immediate value: accurate cycle times, better labor visibility, and fewer manual reconciliations. Start with a narrow pilot, use edge buffering and protocol adapters (MTConnect/OPC UA or sensors), and automate validation to scale without stopping production.
Bring your ERP data to life on the shop floor. Connect your ERP work orders to live machine data so planners and operators work from the same, up-to-date picture of production.
See how JITbase brings ERP data to lifeFrequently Asked Questions
How do I avoid stopping machines during integration?
Use non-intrusive capture methods: read-only PLC taps, network-based MTConnect or OPC UA collectors, and external sensors for spindle power or vibration. Always mount gateways off the control network and use read-only credentials, so that nothing the integration does can write to the controller.
Plan a short pilot on a single cell and set rollback criteria in advance, for example disabling the integration if any unplanned machine stop correlates with its activity. Also validate on a shadow test work order in the ERP so you can verify mappings without updating live production records.
What if my CNC controllers don’t support OPC UA or MTConnect?
Many legacy controllers still expose serial ports, trend logs, or PLC outputs that can be tapped in read-only mode. External sensors such as current clamps and spindle power meters capture cycle boundaries without touching the controller at all.
Alternatively, use a gateway that supports protocol translation, or network capture where your IT policy permits it. Start with spindle-on and axis-motion signals, which give reliable cycle detection even on older controls, and add richer data later once those events are stable.
How can I ensure cycle times from G-code match shop floor reality?
Do not rely on program-estimated times alone. Derive cycles from observable signals: spindle-on plus axis motion windows, tool-change events, and power draw. Compare the derived cycle times against manual time-and-motion samples for the first 1 to 2 weeks and compute a drift metric (median difference and percentage of outliers).
Then apply outlier rules, for example flagging cycles longer than 3 times the median, and surface them in an exception dashboard for rapid review. Over time, the drift metric tells you whether the estimates in your programs can be trusted for quoting and planning.
Who should own the integration and day-to-day monitoring?
Ownership works best as a collaboration: operations owns business rules and exception handling, IT secures networks and credentials, and a small cross-functional team maintains mapping tables and dashboards. Designate a single operations contact to sign off on mappings and a technical owner to manage deployments and rollback procedures.
Keep escalation paths clear. If the reconciliation backlog grows beyond a threshold you defined during the pilot, trigger a joint operations and IT review rather than letting the backlog accumulate unnoticed.
Related Articles